


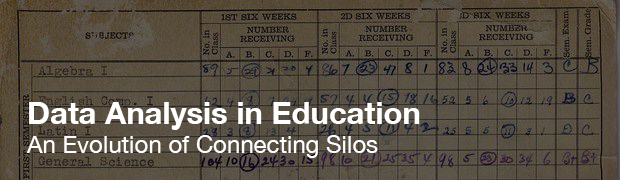
Education has long been an institution of data collection. In the 70s and 80s most report cards were handwritten by the teacher, sent home with the students for their parents to read and sign and return to the teacher to be tucked away until the next marking period. Parents would analyze the data written on the report card to determine if their children were making progress in the curriculum or if they were falling behind other students.
In the late 80s and early 90s the advent of affordable database systems led to a more automated approach to data collection. Teachers were able to enter the student’s marking period grades into a database and hit the print button. They were able to generate report cards instantly for every student. The students were able to take the report card home to the parents and no longer did they have to return the report card to the school for safe keeping. Electronic data storage began in K-12 education.
The Beginning of Electronic Data Storage
As the process evolved from reporting a single marking period’s grades to multiple marking periods teachers and administrators were now able to analyze the student grades as a trend from one period to the next as well as trend from one grade level to the next. They also learned the value of aggregating student grades for all students in a classroom, grade level and a building. As they began to see patterns in their aggregation efforts, administrators began to question the results. There had to be a reason a specific group of students were performing better or worse than others.
It is the job of technology to understand the silos of data that exist in education and the need to create affordable solutions that districts can afford to purchase without compromising student growth.
The 80s and 90s were largely spent collecting data to understand differences in student populations. Student Information Systems were built and sold to school districts at an incredible pace. Every urban and large sub-urban school district invested in the electronic data collection systems. SIS systems and electronic grade books became the new normal in education. As the new normal progressed in data analysis, more questions began to arise. Questions surrounding the curriculum, environmental factors, classroom learning, teacher quality and classroom materials are just a few of the multitude of questions that evolved from data collection and analysis.
As the questions continued to be asked of education creators of data systems continued to expand their offerings beyond SIS and grade book systems. Libraries became automated, publishers offered electronic curriculum materials, and data collection in these various departments became mainstream. Registrars managed the SIS, teachers managed the gradebooks, librarians managed the library databases, curriculum directors managed the curriculum database, assessment departments managed the high stakes test results, athletic directors managed the athletic databases, and so on. Data collection became a system of silo management.
Analysis and the Introduction of Data Silos
Now that school districts have all this data collected, they need to analyze the data as the fruits of collection efforts. For instance, how does a minority student perform in the classroom when checking out 3 or more library books during a specific curriculum unit while participating in after schools athletics? This requires a list of minority students, another list of their grades, a list of all books checked out for that group of students, results from their unit tests and a list of minority students participating in athletics. From those lists, a data analyst is now required to create a report for students who appear in all 5. School Districts began to invest in the human capital needed to analyze data report requests.
Large school districts invested in data warehousing technology to centralize the data stored in individual silos. This was a luxury largely reserved only for the largest school districts with the largest tax base as the systems are very expensive to implement and maintain.
No Child Left Behind: Government Requirements and Reporting
After the No Child Left Behind Act (NCLB) was passed districts the country over, of all shapes and sizes, began to scramble for a way to aggregate silos of data to report back to the states. QlikView was quickly adopted by many districts as a way to connect the various silos to create meaningful answers to the question “Which children are we leaving behind?”
With the passing of the torch from Bush to Obama, NCLB was quickly replaced with Race To The Top, commonly referred to as RT3. The new administration identified flaws in NCLB and diverted funds to the states who are doing it right as well as the states who need assistance in education. One of the 5 tier 1 score categories in RT3 is “Data Analysis and Reporting”. States are scored on systems they currently have in place for collecting, analyzing and reporting data on student achievement. Delaware and Tennessee were the first two states to win funding in RT3 because of their excellent scores in all 5 categories. The other 48 states quickly learned that in order to gain access to the funds, they need to do a better job reporting their own data in the application process.
Round 2 of RT3 awards were awarded to 20 states leaving many states still scrambling for a solution to connect their silos of data. Solution providers have recognized the need in education as well as the economy of education. The need to connect silos of data still exists in districts of every size and demographic. A large percentage still need a solution to connect their data but most of those have to make tough budgetary decisions of how to fund the solution in their already shrinking economy.
The history of data collection in education has evolved greatly in the last 30 years and they will continue to evolve with technology as long as there are federal and state funds available to add to their budget. It is the job of technology to understand the silos of data that exist in education and the need to create affordable solutions that districts can afford to purchase without compromising student growth.