


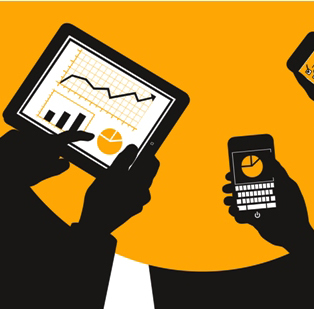
Forbes recently reported that, according to Aberdeen Group, 65 percent of business decision makers face a shrinking “decision window.” So if a “picture is worth a thousand words,” then why not make data discovery visual for business users so they can easily analyze and assimilate information? Visualization provides rapid access to data in a format that’s easy for business users to digest and use. According to Aberdeen research, managers that make use of visual discovery tools are 10 percent more likely than their peers to access the information they need in the time necessary to impact decision making. This also impacts IT, as it frees up critical resources to support users more effectively.
Instead of poring over pages of reports the data can be viewed in bar charts, line graphs, pie charts or integrated with geo-spatial tools, so you can make a lot more sense of it. If sales people could visually see their pipeline, commitments, confirmed orders, and cancellations, they could be so much more productive. They could plan out their sales route for the day – and weeks – so much more effectively.

Obviously, some industries generate more data than others like Telco, Retail, Oil and Gas and Utilities, for instance. But the nature and visualization of this data is different as it comes from different sources and is used for different types of analysis. Large amounts of data in Oil and Gas is exploration data and needs to be combined with GIS systems for visualization and analysis.
Telecom operators, Media companies and Utilities on the other hand generate massive amounts of data every day related to their subscribers, network operations, and services. Telcos need the ability to analyze this big data quickly and effectively and are turning to the new analytics infrastructure with in-memory computing to crunch the data in seconds vs. days. As a result, they can do what-if analysis, model data, and run sophisticated data mining and forecasting algorithms that return answers within minutes, enabling them to fine-tune and refine their offers and service bundles to accurately reflect the needs of their subscribers. The speed and agility of analyzing very large amounts of data provides the Telco with an opportunity to innovate more quickly and develop entirely new business models not possible before. T-Mobile is analyzing very large amounts of campaign data in near real-time to innovate and adopt new business models not possible before.
Are you ready to innovate and develop new business models? Do you think visualization of big data can help?