At this point, you should have already established a vision of how analytics — enterprise performance management and business intelligence — can help achieve your organization’s business objectives.
You may have decomposed big topics (e.g. “reduce manufacturing waste of Product X by 10 percent”) into tighter areas (e.g. “vendor and supply chain quality,” “manufacturing specifications,” and “financial controls”). Each subtopic has associated initiatives or projects. Taken in total, you have a portfolio of projects to be organized, evaluated, scheduled, and lastly funded.
Now, the task at hand is evaluating the collection of initiatives and preparing a rationalized list of projects. This project matrix is the basis for the deliverable document — the roadmap. The EPM/BI roadmap is the visualization of the initiative matrix.
The Initiative Matrix
The initiative matrix is a simple two-by-two grid that visually aligns the business objectives with the initiatives. This simple exercise serves two purposes:
1. Validate that all “big topics” are addressed by a project and that all projects solve a “big topic”
2. Foster communication and continued team buy-in
The initiative matrix provides a macro view of how the organization chooses to close the gap and reach its business objectives.
A simple ranking matrix
Rationalizing and evaluating the project list can be as simple as assigning a sequencing order plus a relative ranking of value delivered and project complexity. Implicitly this compares expected project costs with revenue gains (or cost savings) — but not on a formal level. This is a fully acceptable method for low cost investment or less risky projects.
A complex ranking matrix
A more robust evaluation process should consider the project’s financial payback, technical complexity, execution risk, organization change impact, and implementation time. Each project is awarded a score by category and tallied to compute a total score. Then, a threshold is determined. All projects above the threshold will be funded, and projects falling below the threshold will considered at a later steering committee meeting.
The Roadmap
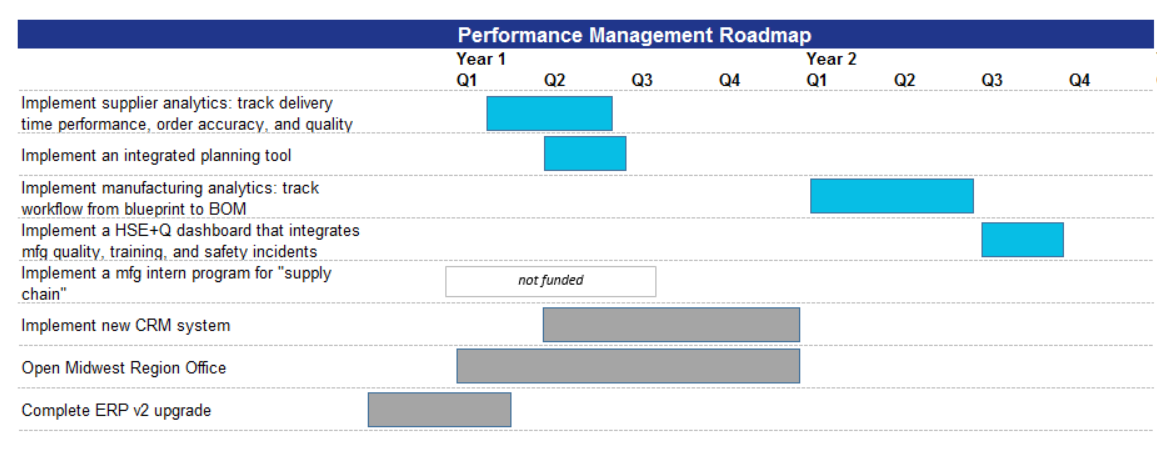
Now comes the fun part: preparing the roadmap. Be sure to include critical projects that could impact the delivery and timeline of the project portfolio. These are noted with grey bars in the example below.
There is a difference between roadmaps and project plans...
-
The roadmap shows the major initiatives by major category time-phased across logical rollout groupings. The roadmap highlights key dependencies between and across initiatives and serves as the improvement “blueprint."
- The project plan is a collection of activities across time to accomplish a specific objective with defined scope, resources, and assumptions. Typically this is tactical in nature.

Monitoring Business Performance
Preparing the initiative matrix and roadmap sets the path forward to achieving operational business objectives. The value in this exercise is highlighted by McKinsey’s research that firms that actively managed their strategic and operational portfolio achieved up to 40% greater value than firms that took the status quo approach.
What’s next? Monitoring and controlling the project portfolio. This is the perfect time to establish a PMO framework that collaborates with executive leadership to monitor business performance. The management model is depicted below.
(1) “How to put your money where your strategy is”, McKinsey & Company, McKinsey Quarterly, March 2012
Getting Started
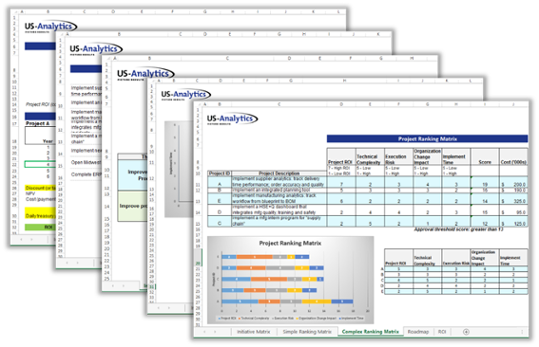
Ready to rank your initiatives and build your roadmap? Download our free workbook containing all of the templates shown above: the initiative matrix, simple ranking matrix, complex ranking matrix, and roadmap. The workbook also includes a project ROI calculator to help you determine when your project will pay for itself.
If you'd like help using the templates and planning your initiatives, our process & advisory team is happy to assist — just request a free consultation!


![How to Build an EPM/BI Roadmap [5 Free Templates]](http://www.us-analytics.com/hubfs/EPM%20BI%20Roadmap-1.jpg)


