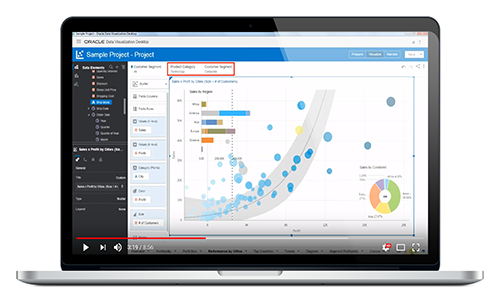

The recent release of Oracle Analytics Cloud (OAC) V4 comes with many changes to Oracle Data Visualization (DV) Desktop version. The latest version of DV expands upon the current features — visual data storytelling, end user self-service, and mobile accessibility — to give you an even better user experience.
In this blog post we’ll give you an overview of several new features made to…
- Your Homepage
- Data actions
- The storytelling interface
- Data flows

Changes to Your Homepage
You can now have a truly unique DV experience by customizes your homepage. Simply click on the menu icon in the top right corner and click “customize this page.” The customize box will then appear, allowing to you select what you want to see on your homepage, including:
- What’s new
- Data sets
- Projects
- Data flows
- Show descriptions
- Show Getting Started Banner
Create Menu
DV V4 now includes a “create” menu, allowing you to quickly go into a new content design process. Click on “create” in the top right-hand corner (next to the menu icon). You will be prompted to choose from the following options:
- Project
- Data set
- Connection
- Data flow
- Sequence Script
You’re also able to toggle the main menu on or off with one-click from any screen in DV. Simply click on the menu icon in the top left-hand corner of the screen next to the Oracle logo.
Properties Tab
The properties tab automatically opens every time you click on a Data element. Users are able to set default properties for each column.
Visualizations
There are many changes to make the tool’s visualization features even more comprehensive. Changes include:
- You can toggle the pane’s visualization properties when you activate a visualization in the canvas.
- Time based objects automatically expand to show all the levels where they can be used.
- You’re able to drag-and0drop to set visualizations at the best time level.
- Time-based object defaults for level and formats are set in the column properties, per column. You can override time levels at the visualization level, in the grammar pane of each visualization.
- Aggregations can be shown as a percentage of rows or columns in Pivot Tables with one-click.
- Filters can be set to apply to one canvas only or all the canvases. Visualizations can now be easily duplicated or copied across canvasses.
Data Actions
Data actions (navigations) can be configured on any data elements and contextual value can be passed to external URLs… or to internal canvases with various interactions and context passing options…
Once configured, actions appear in the right-click menu in visualization where the column is used.
Consuming Metrics
DV now allows you to consume metrics as “categories” for any visualization. It will automatically bin metrics when they are used as categories and enables users to override the default bins.
Unrelated Data Sources
Unrelated data sources can be used simultaneously on any single DV Project. Visualizations from unrelated data sources can be exposed on the same canvas.
Changes to the Storytelling Interface
The storytelling interface is more intuitive and comprehensive with various new options, including:
- Auto
- Custom
- Galaxy S5
- iPhone 5
- iPhone 6 Plus
- iPad
- iPad Pro
Explain right-click Feature
The Explain right click feature allows you to rapidly understand the main drivers of any attribute values in your data. In a few seconds you can see basic facts, key drivers, segments, anomalies, and outliers are all visually represented. Any of these insights can be selected and added to your project canvas for further analysis.
Data Flows
Oracle DV allows you to create chains of data flows, sequentially executing (these are sequences). New capabilities in data flows include:
- The ability to rename and describe any step in the flow
- Capability to merge data sets together (union data intersect, etc.)
- User-friendly user interface for setting filters
- New nodes added, including:
- Binning
- Grouping
- Running aggregations
- Time series forecasting
- Analyzing sentiment
- Ability to train model then apply trained models to your data by using:
- Train numeric prediction
- Train multi-classifier
- Train clustering
- Train binary classifier
- Train custom model
Once a model is trained it shows in the list of ML objects with various details about its quality. Existing models can either be ran in data flows to create prediction data sets, or trained models can be invoked directly from the DV canvas interface by using the scenario feature (select “Apply Model,” then “Create Scenario”)
New Connection Types
New connection types were added to allow DV data sources from more cloud services, including:
- Oracle Big Data Cloud (Beta)
- Oracle Data Warehouse Cloud (Beta)
- Oracle Talent Acquisition Cloud (Beta)
To learn more about using new features in Oracle Data Visualization, watch the video series...