


In part one, I talked about the common concepts and goals that Tableau Prep and Oracle Data Flow share. In part two, I looked at a brief overview of both tools and took an in-depth look at Tableau Prep.
In this third post, let's dive deeper into Oracle Data Flow.
For these examples, I am going to be using Oracle Data Visualization Desktop 12.2.4.3.0 (the latest version as of this writing).
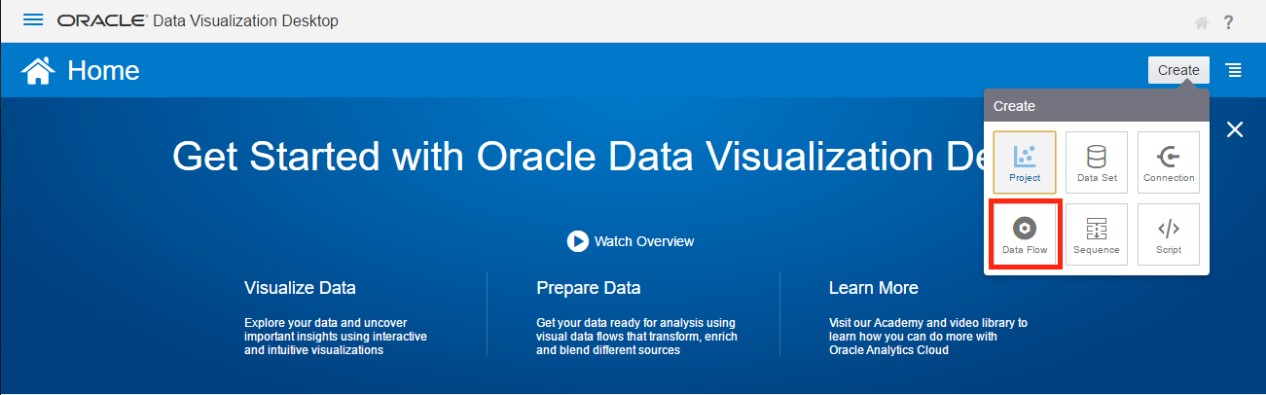
First, I’m going to import the three World Cup Excel files used in the Tableau Prep example. This was accomplished by clicking Create in the top right-hand corner of the ODVD home page, and then selecting Data Flow.
When creating a new Data Flow, the Add Data Set window is displayed and prompts the user to select a source. The window will show any data sources created previously and also allows you to create a new source.
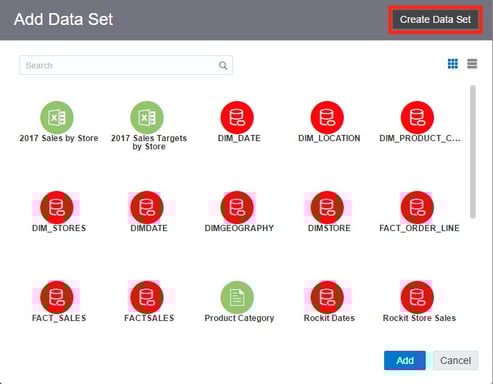
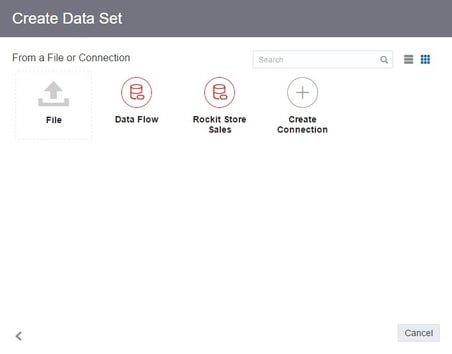
I clicked on Create Data Set and then click File to import the first spreadsheet.
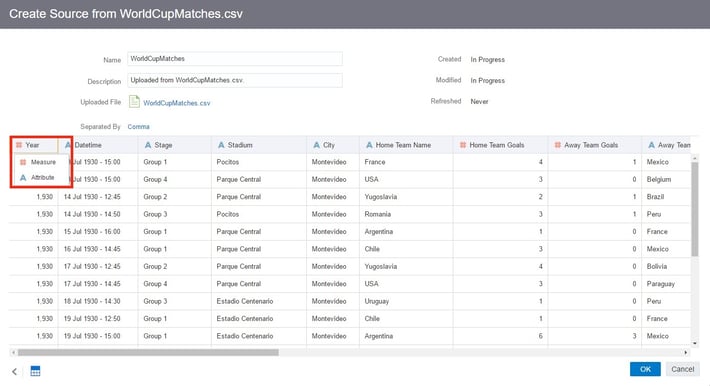
Once a source is selected, the Create Source window is displayed and allows the user to rename the source, add a description, and change some of the basic characteristics of each column before import. DV will automatically try to import number columns as measures, so I needed to change them to attributes so that they are not aggregated.
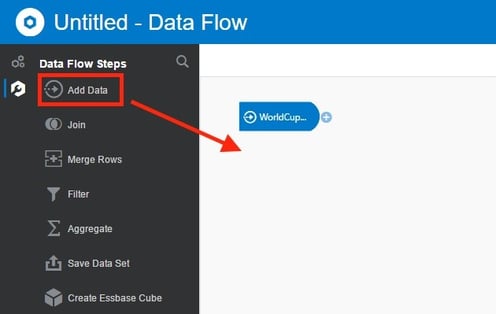
Clicking OK takes you to the Data Flow editor. From here I need to import the remaining two spreadsheets. To do this, I simply dragged Add Data under Data Flow Steps into the edit window and imported the sources as before.
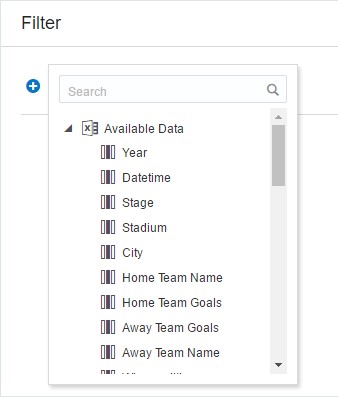
If I click on the + icon on one of the imported data sets, it brings up all the available options for the current flow.
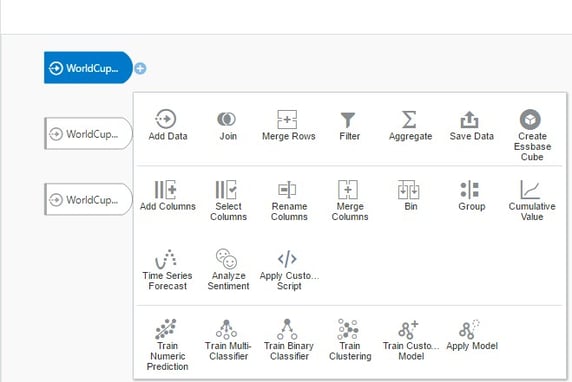
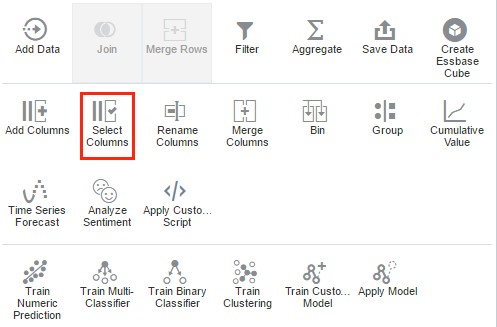
I’m not going to cover each option at this point, but I do want to highlight a couple of features that are unique to Data Flow.
One of the biggest features is applying machine learning models. While I am not going to go over this feature in great detail, the basic idea is that you can create a Train Model, which uses scripts that define the interface and logic for a task based on known data. You can then use that model to score unknown data or to predict dynamically within a visualization.
Another feature is the ability to apply custom scripts to the data flow. The interface reads the options and parameters defined in the script and then uses this to produce specific types of data sets.
The last feature I want to talk about here is Time Series Forecast. This function takes a time column and a target column and generates forecast values in a new column for the specified number of periods. Although this feature is not unique to Data Flow only (you can accomplish this with forecast functions within DV, OBI Analytics, or Tableau), it is nice that you can include it as part of the output dataset itself rather than doing it after.
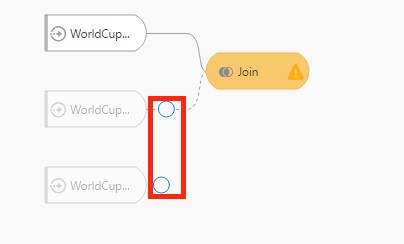
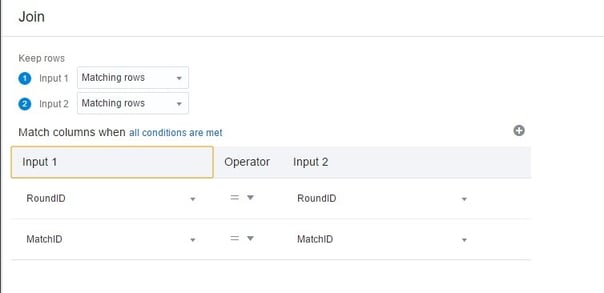
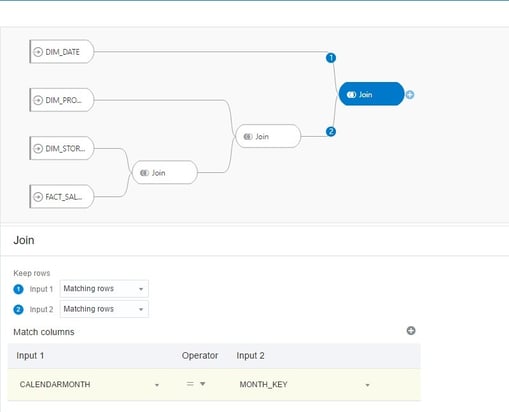
For now, I’m going to join my three spreadsheets using the Join option. With the join option selected, the edit window displays a circle selection beside each of the remaining data sets. Clicking on this icon for the desired data set brings up the join interface where you can specify the columns to create the join on and specify matching or all rows for the type (inner, right outer, left outer or full outer).
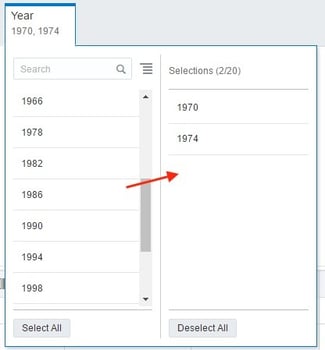
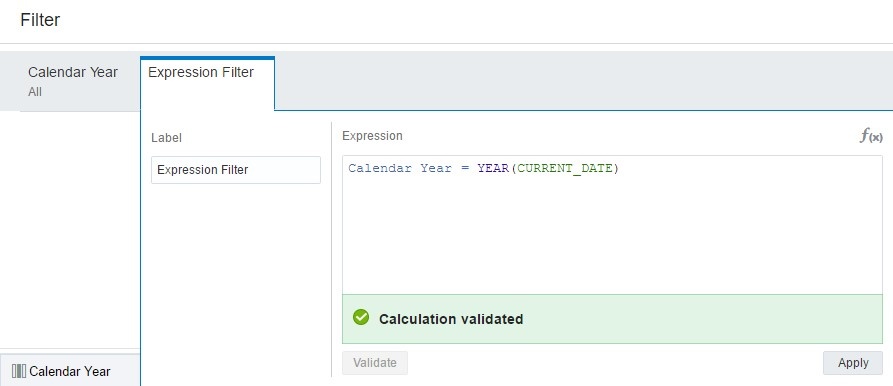
After joining my data sets, I am going to add a filter for the Year column to only show years that include 1970 and above. I can accomplish this by selecting the filter option and adding each year from a list…
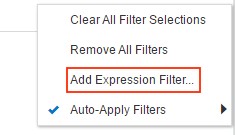
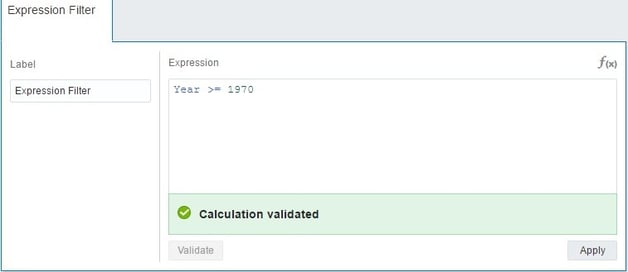
…or create an Expression Filter and write the filter condition manually.
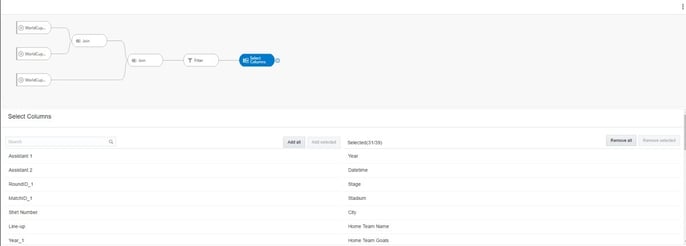
Now, I am going to remove some unwanted columns. This is a very straightforward process. I selected the select column step and then selected the columns I wanted to remove and clicked Remove Selected.
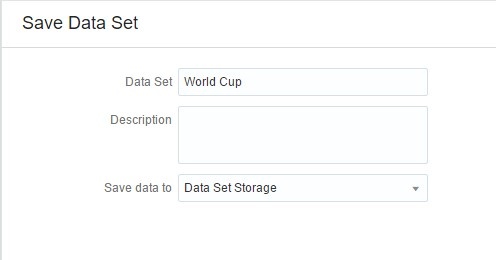
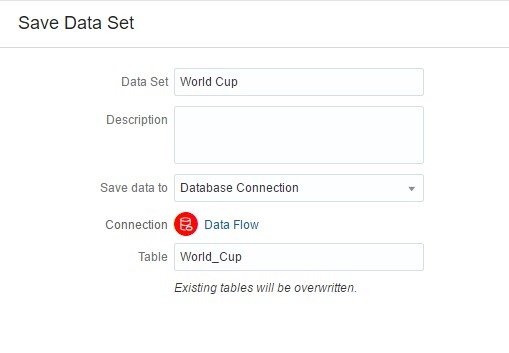
Next, I’m going to add the final step in my Data Flow. By clicking on Save Data I can define the name, description, and type of output I want. If I choose Data Set Storage, the output of the Data Flow is saved as a file in a designated pre-defined location.
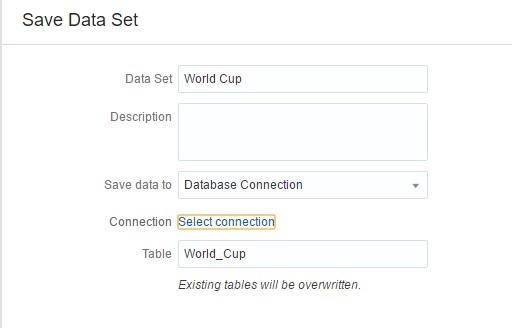
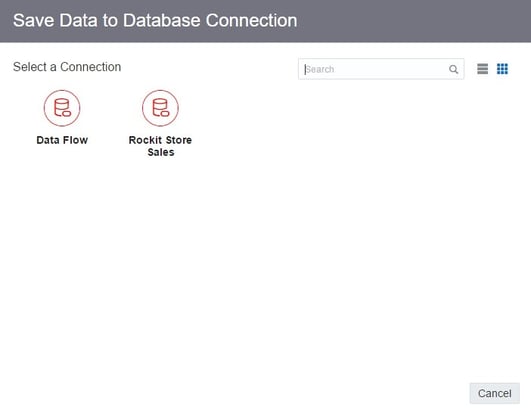
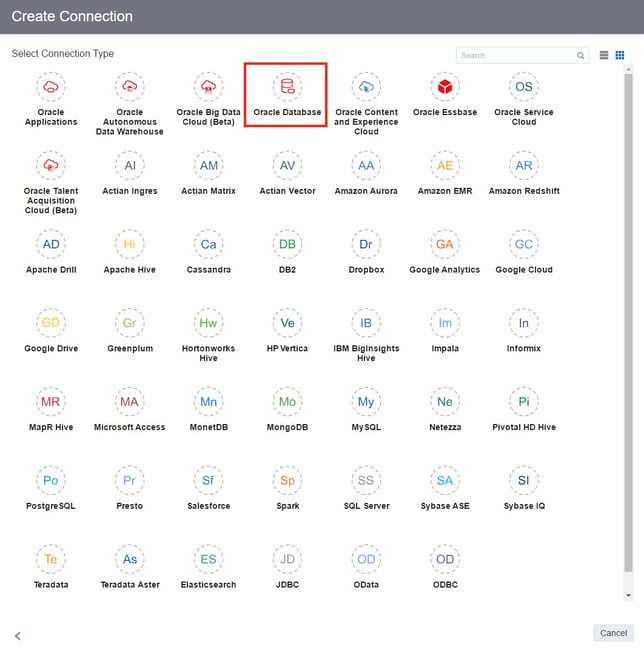
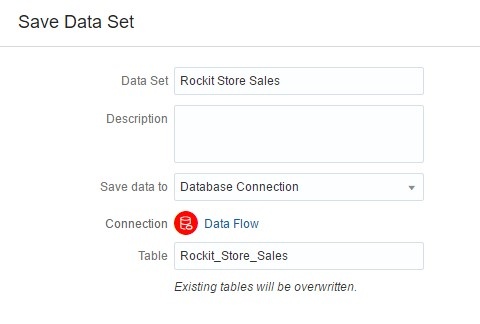
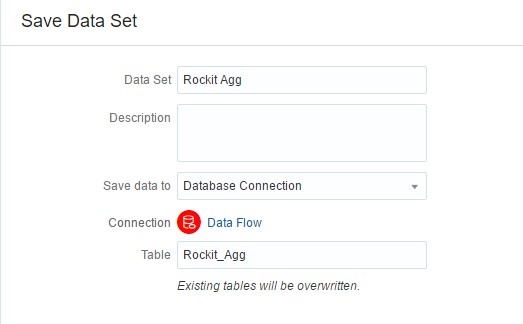
If I click on the dropdown under Save data to, I can select a Database Connection option. This allows me to save the output of my Data Flow as a table in the source database specified by the connection. I am going to use this option and put the data set as a table in my Oracle Database.
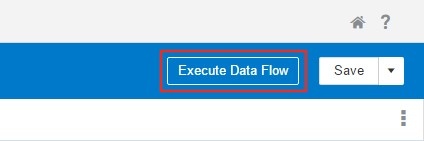
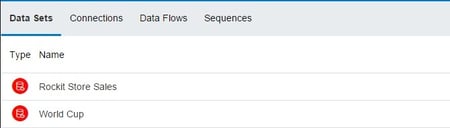
Now, I am going to click Execute Data Flow. This is going to run the Data Flow and save the data set in the specified location and create a new data set for use with DV.

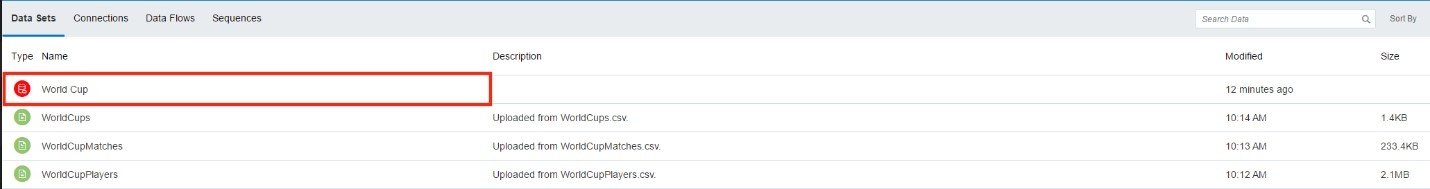
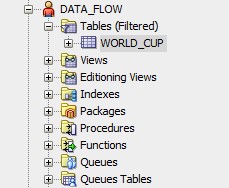
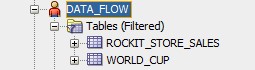
I can navigate to SQL Developer and look at my newly created table.
I really like this feature and think it expands the use of Data Flow beyond Oracle DV (creating new models from existing ones, consolidation of complex multi-source projects into an easily accessible source for other analytic tools, requirements that involve sources outside standard enterprise ETL protocol, creating aggregates).
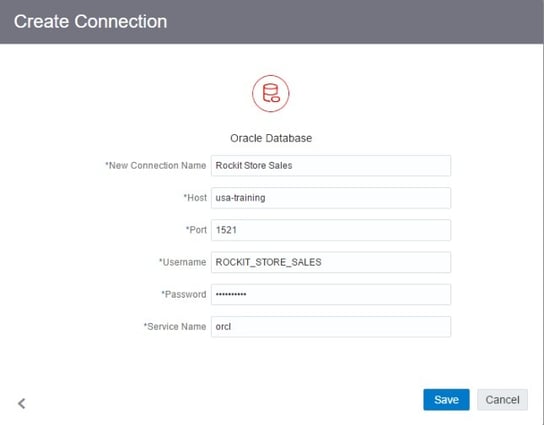
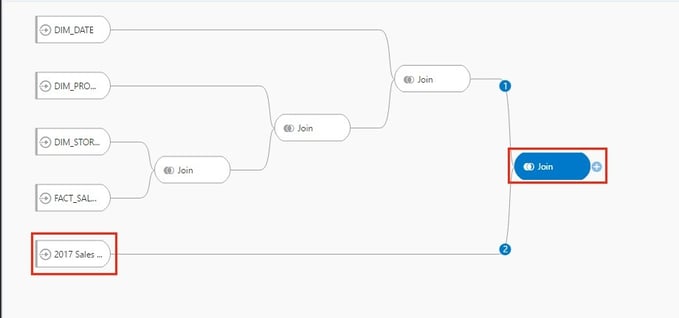
Now, let’s look at combining different sources into a Data Flow. Once again, I’m going to use sales data coming from my Oracle Database and sales target data from my spreadsheet.
I’ll start by creating a new Data Flow and making a connection to my database.
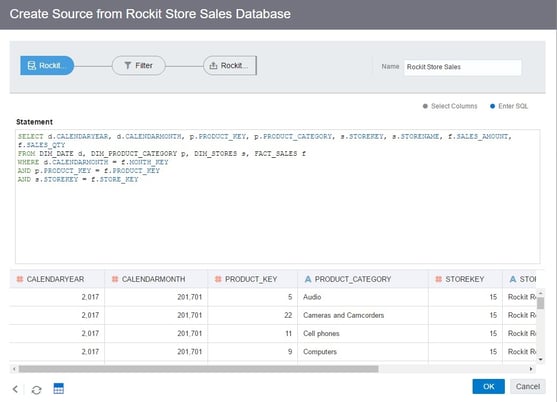
From here, I can either select each table individually and import the columns or construct an SQL statement to consolidate and bring in selected columns from each table in as a single source.
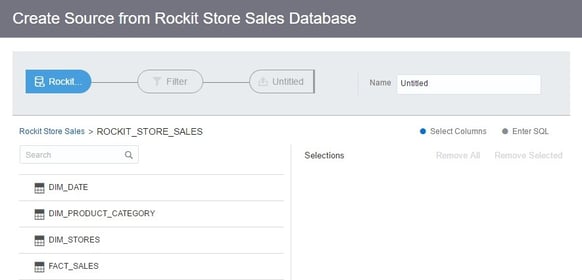
I’m going to choose the first option and bring in all of my tables individually.
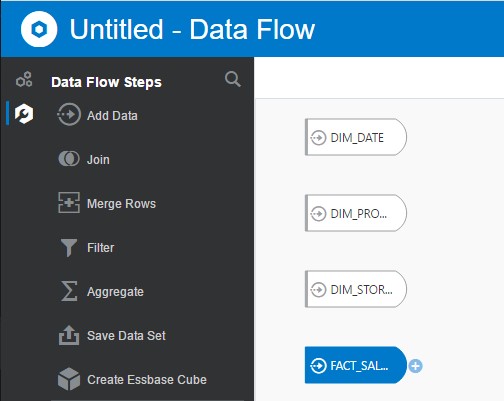
As in the previous example, I can join each of my tables together using the Join operation by clicking on the + icon to the right of the source.
Now, I’m going to bring in my Store Targets spreadsheet and join it to my existing flow.
At this point, I’m going to do a little cleanup, remove some unneeded columns, and rename a few of the columns to improve readability.
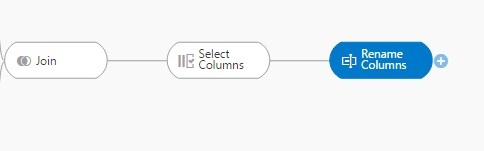
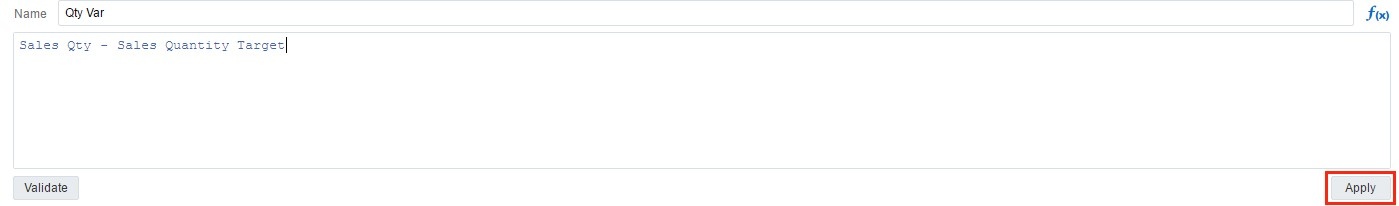
Now, I need to add in two calculated measures for my variance. I can select Add Columns and type in my calculations in the edit window.
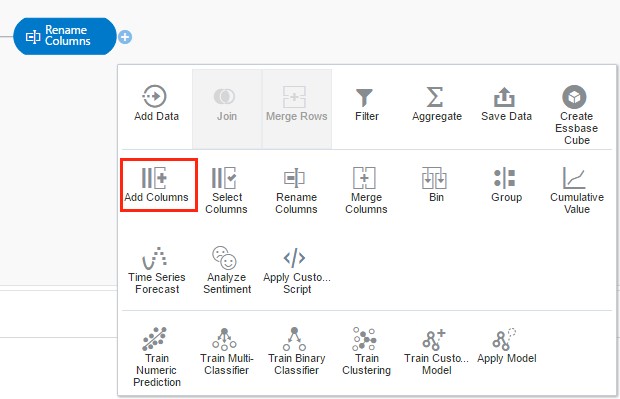
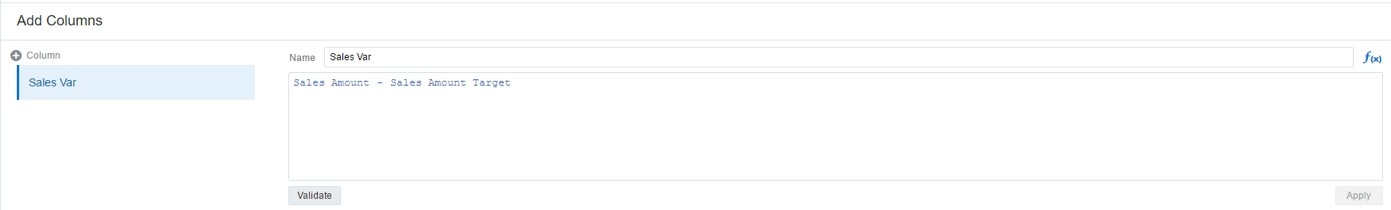
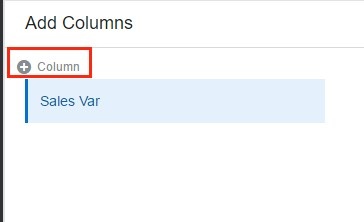
With the add columns step, you can add as many calculated columns as needed by clicking the + in the left-hand corner. After each calculation has been defined, you can add them into the Data Flow by clicking Apply.
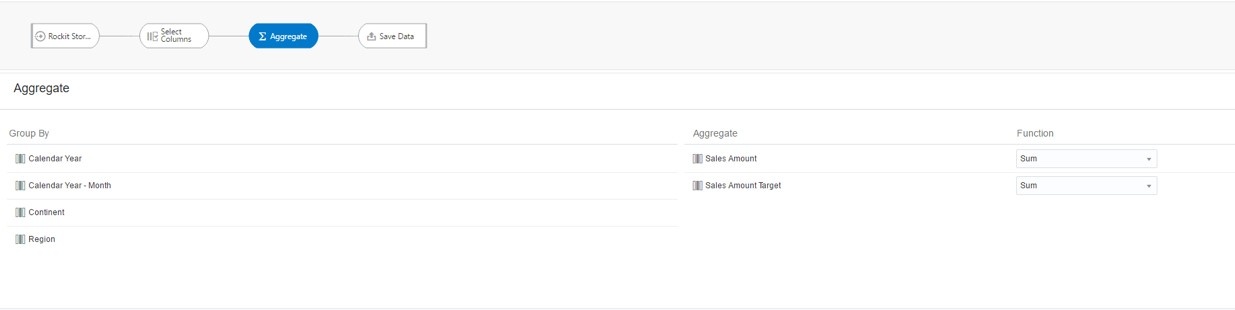
Now, I’m going to define my aggregation. I’ll select the Aggregate step where I can define the aggregations for each column under the Aggregate pane.
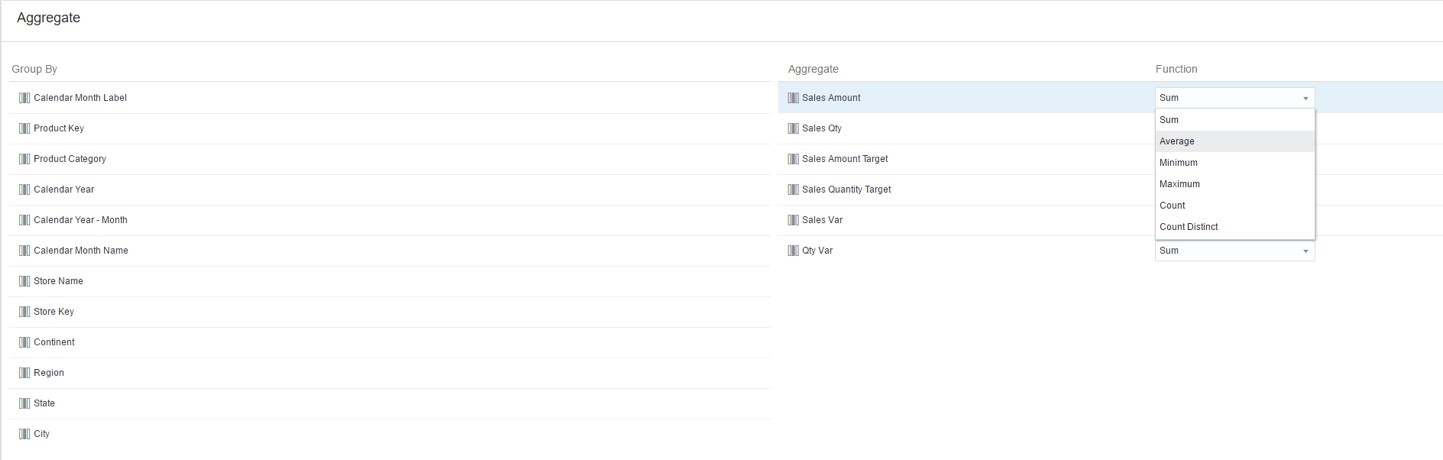
If I want to add an aggregate for a column under the Group By pane, I can click on the desired column and select Aggregate to move it into the Aggregate pane. I am going to leave the default Aggregate selections for now and move to the output step.
Note: Unlike Tableau Prep, it is not possible to define multiple Outputs in Data Flow.
As in the previous example, I’m going to select the Save Data set and choose my database as the output destination and execute my Data Flow.

This creates a new table in my Data Flow schema and creates a new data set to use for visualizations.
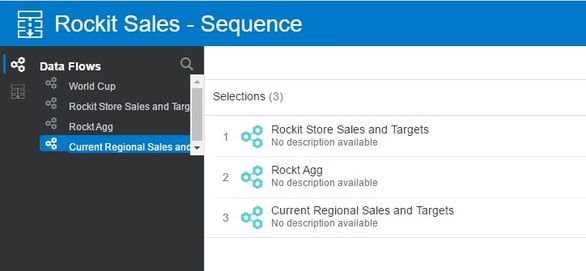
Now, let me take a moment to talk about Sequences. Although not technically a part of Oracle Data Flow, it is a part of Oracle DV and requires Data Flow for its input. A Sequence lets you define one or more Data Flow(s) and will execute them in the order for them to exist in the Sequence.
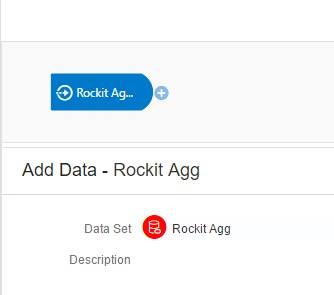
So, let’s say that I have my Data Flow for store sales and targets that I created in the previous example, and I want to make two additional flows to put in a Sequence. One flow will build an Aggregate table that will be saved in my database with measures for Sales and Sales Targets by Month, Continent, and Region. I’ll build a new Data Flow that uses my store sales data set created in the previous example and add the appropriate steps.
The other Data Flow will create a data set based off the Aggregate Table I built in the previous flow for use in Oracle DV. It will show the current year’s sales, sales target and sales vs target by region.
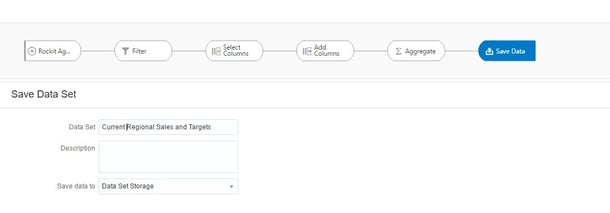
Now, I can build a Sequence that will run each Data Flow that will update each source in order: Store Sales and Targets > Aggregate > Regional Sales and Targets.

This is a fantastic feature that has a wide variety of use cases and makes updating multiple data sets that use the other Data Flow’s a breeze.
Oracle Data Flow — The Good
- Simple to understand and use
- Interface is elegant and uncluttered
- Machine Learning, Scripts, and Forecasting can be used as a part of Data Flow and be inserted directly in the data set
- Output destination can be set to DV data set or database
- Data Flows can be executed from the DV interface and don’t require each flow to be opened individually.
- Sequences can be built to trigger multiple Data Flow’s in any order required
- Data Flows can be scheduled, currently available on Oracle Analytics Cloud (OAC)
- Ability to turn off auto preview to aid fast workflow
Oracle Data Flow — The Bad
- Intermittent errors thrown by joining two data sources – sometimes when using the join operation, an error is thrown if two matching columns are not automatically identified. While not a huge deal, it is a bit annoying having to close the error message box before defining the join manually.
- Scheduling Data Flows not available on-premises – As of this writing, scheduling a Data Flow is only available on OAC.
Final Thoughts
Both Tableau Prep and Oracle Data Flow introduce some exciting new possibilities in the world of data transformation and integration. While I think both tools have their place, I can’t see Tableau Prep being used in an enterprise-level environment with data that is updated frequently due to its inability to schedule workflows or store passwords for sources that require it. Feel free to share your thoughts and experiences with us in the comments section! Thanks for reading.
You might also be interested in...