

In part one of this series, I shared an overview of the common concepts that Tableau Prep and Oracle Data Flow share as well as a brief look at the tools themselves. In part two, I want to take a more in-depth look at Tableau Prep and share my experiences using it.
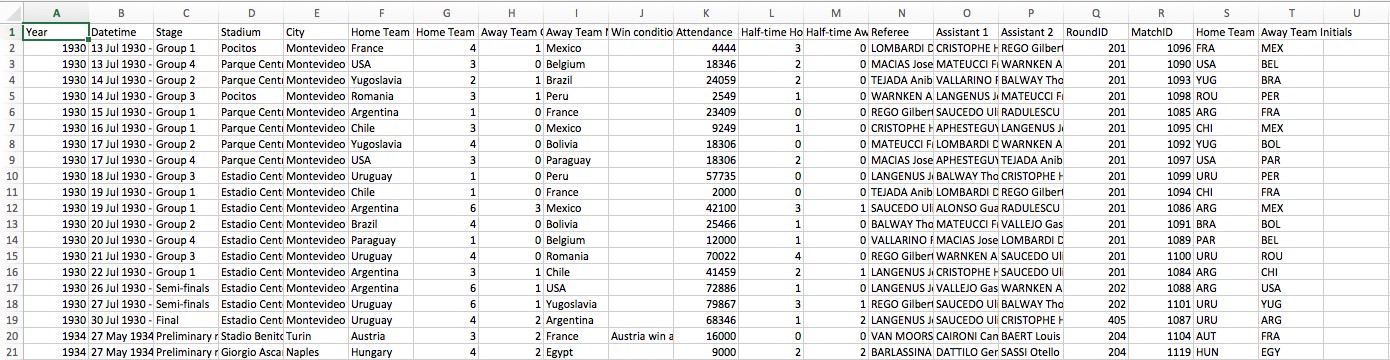
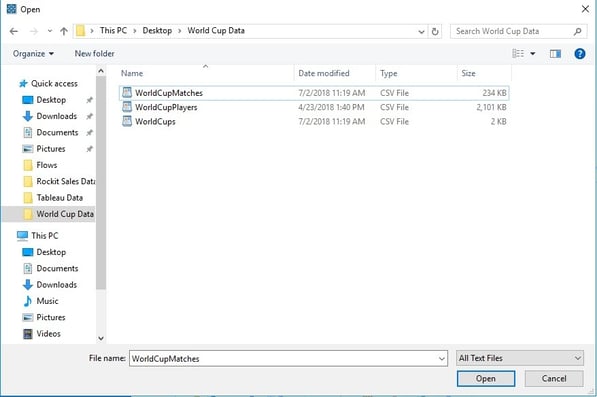
In my first example, I have three spreadsheets containing data collected from every World Cup Match from 1930 to 2014. One contains detailed information about each match individually.
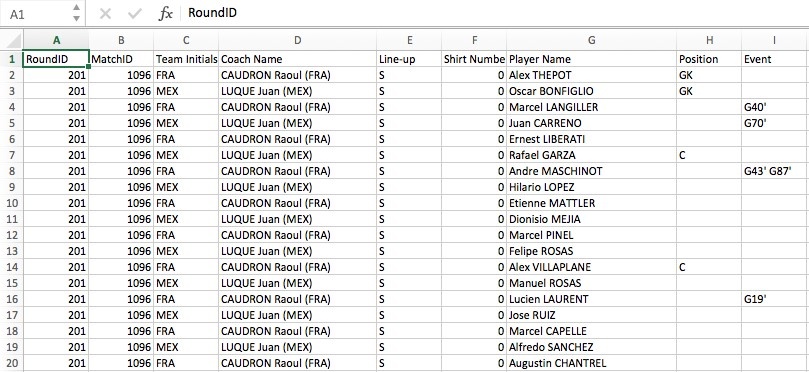
The second contains information on players…
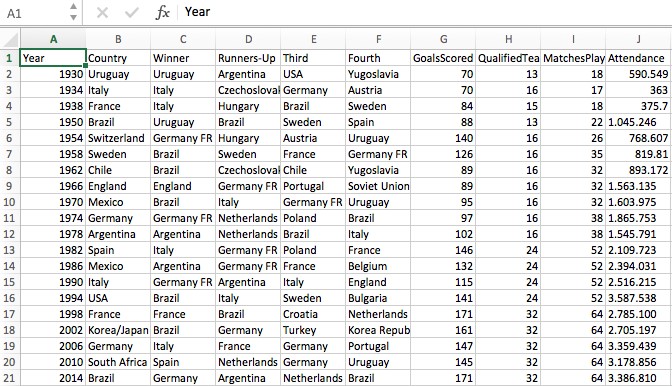
…and the third contains high level information about each World Cup.
Downloading and installing Tableau Prep was a breeze. Those that have installed Tableau Desktop will find this process largely similar. Once installed, I opened Tableau Prep via the desktop shortcut. In this example, I’m using the latest version (as of this writing) 2018.1.2.
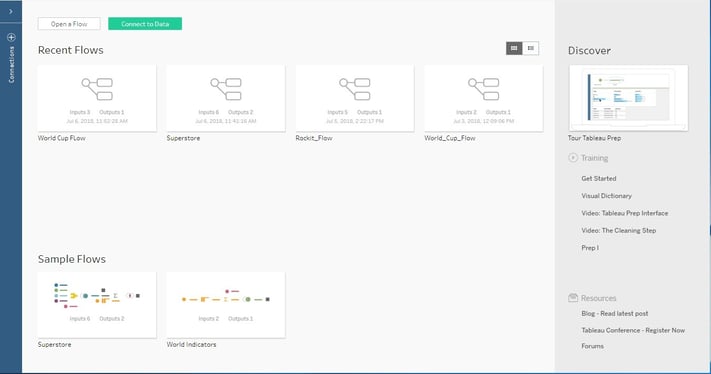
Upon opening Tableau Prep, the home screen contains a connections pane, recently accessed workflows, a sample workflow section, and the familiar discovery and resources pane.
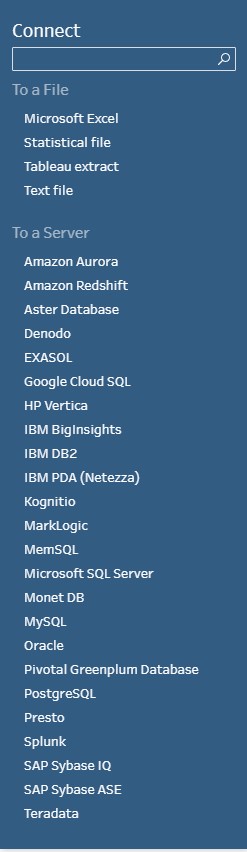
To connect to my spreadsheets, I click on the connections icon and import all three using the browser window.
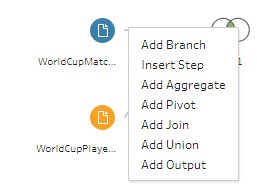
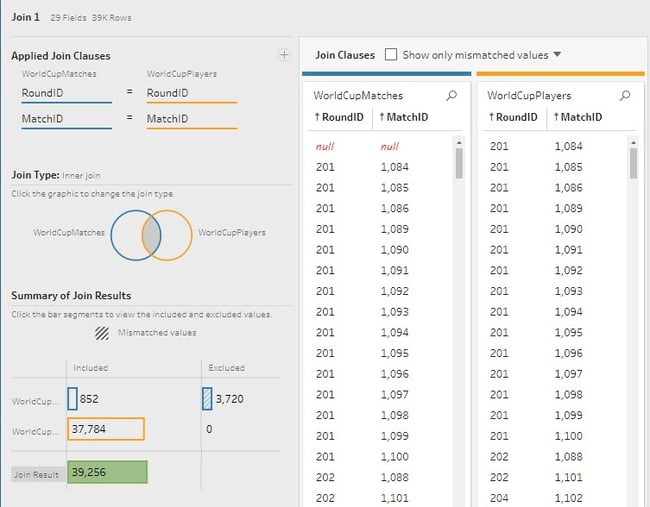
From here I can add joins by selecting it from the add step interface or by dragging and dropping the sources over one another.
The join interface is relatively straightforward and selecting the type of join is accomplished easily by clicking on the join diagram.
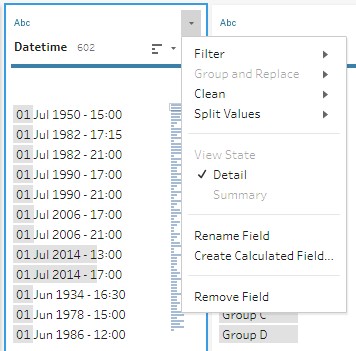
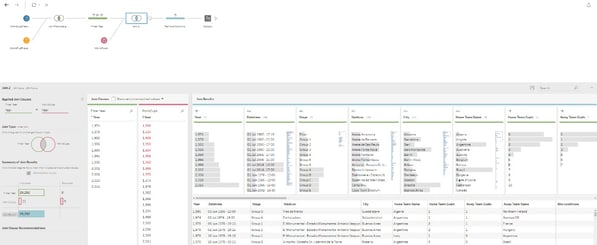
From here I created a filter for Years, an additional join, and removed a few unneeded columns with relative ease. With each step, the data preview is displayed showing a snapshot of how the data is being transformed.
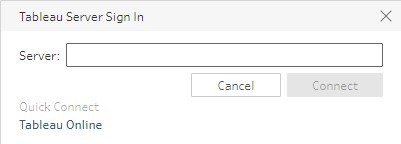
The output step is the last addition that needs to be added in a workflow. Here you can define the type of output file, destination, or publish to Tableau Server or connect with Tableau Online.
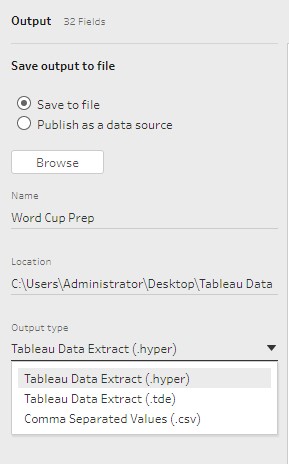
For this example, I selected the default .hyper extension for my source file and saved in a designated folder on my desktop.
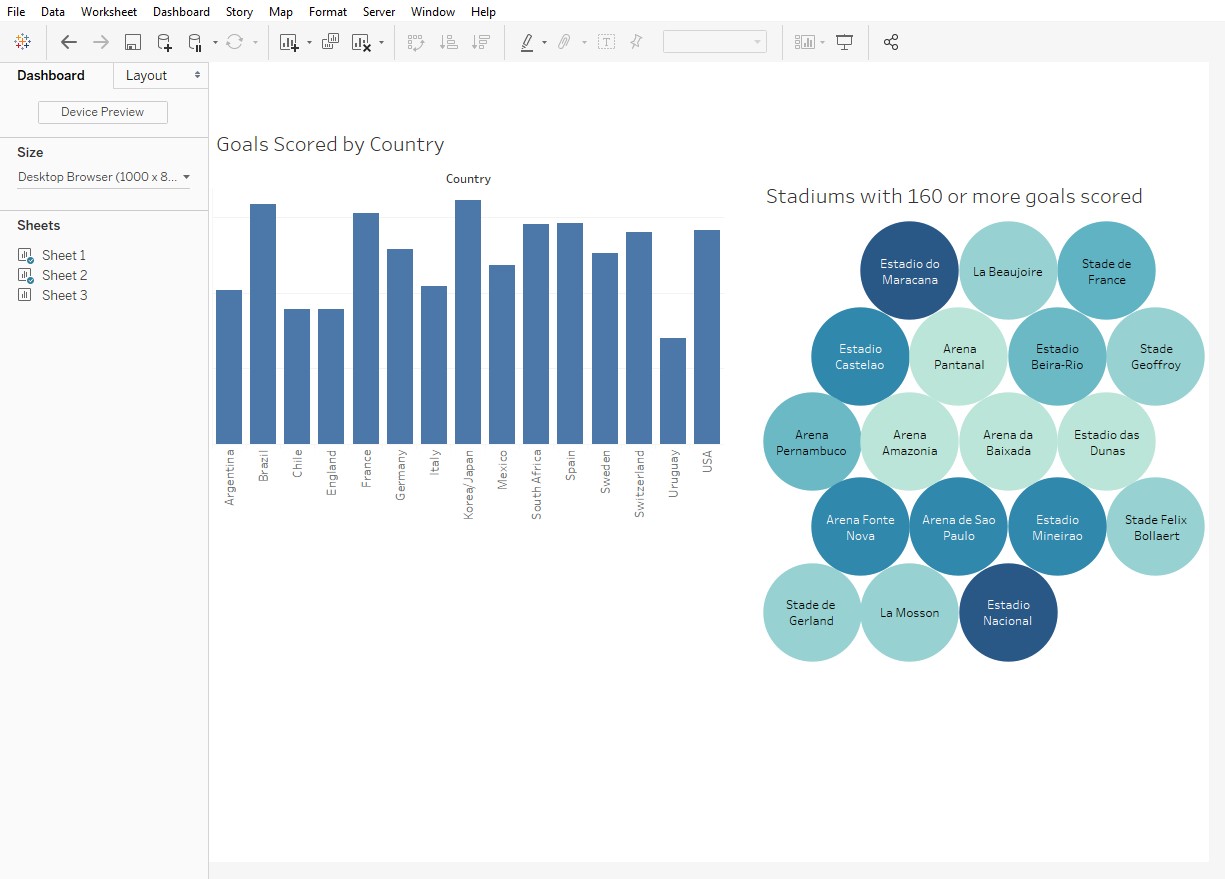
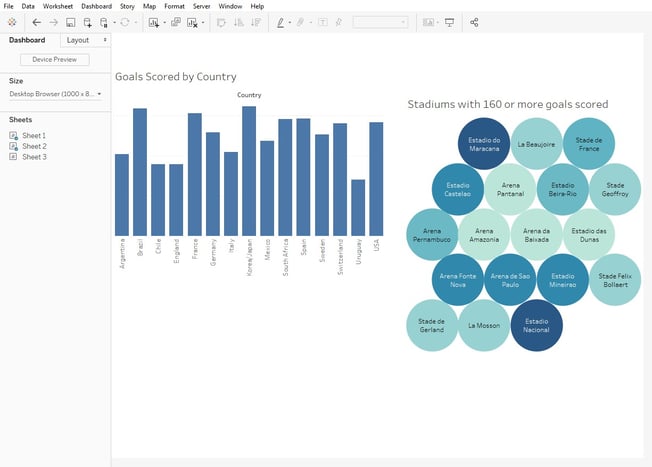
Using Tableau Desktop, I can easily connect to my newly created dataset and create visualizations.
Now, I am going to try putting together a workflow from different types of sources. I have an Oracle Database with a schema that contains retail store sales data. I am going to attempt to join to store targets information that is in a spreadsheet.
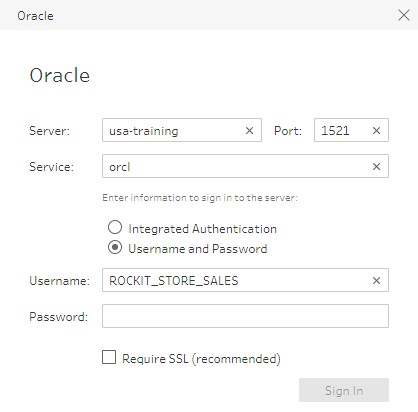
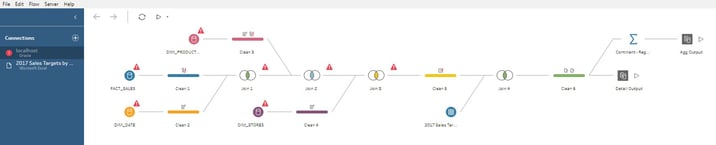
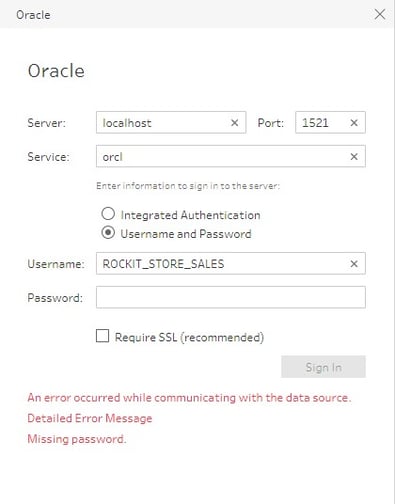
First, I’m going to connect to my database using the Oracle connector in Tableau Prep.
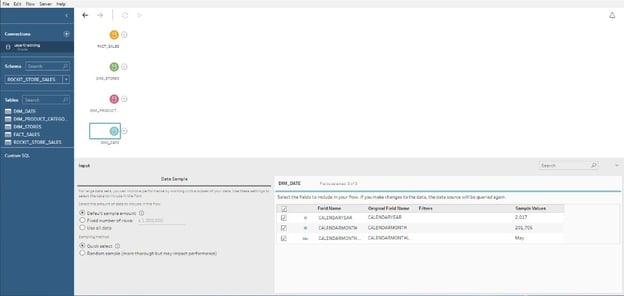
Once the connection is made, I have a couple of different options for bringing in my data.
- The first option is to select the appropriate schema and bring in each table individually as pictured below.
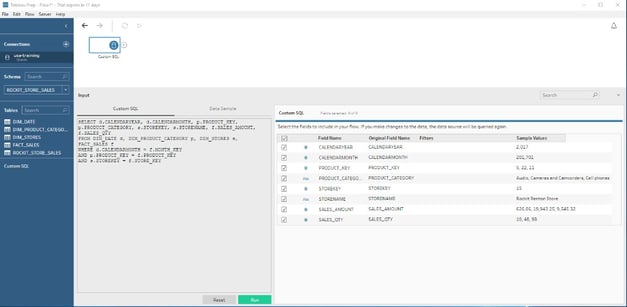
- The second option is to specify a custom SQL statement and consolidate the required columns into one workflow source.
For this example, I am going to go with the first option.
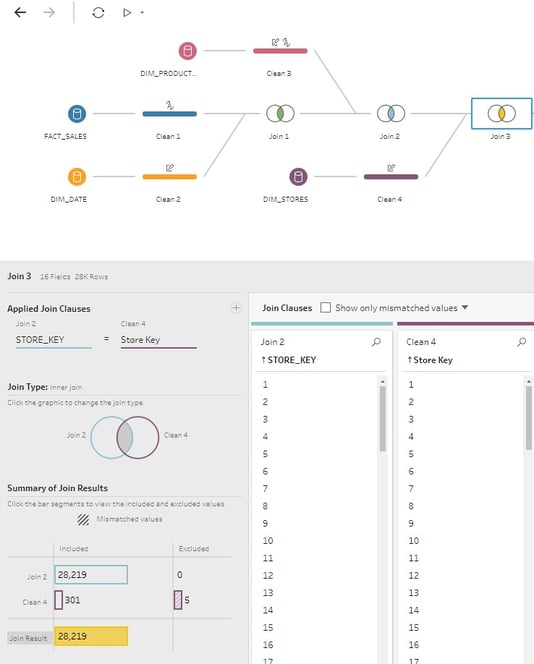
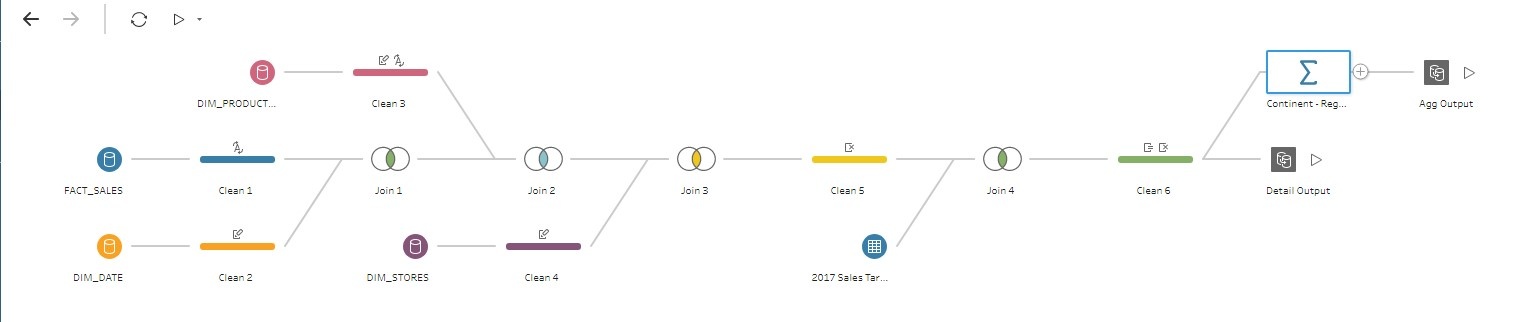
As in the previous example, I am going to join together each workflow source (table in this case) and do a few simple cleanup operations such as removing unwanted columns and renaming some columns to be more user friendly.
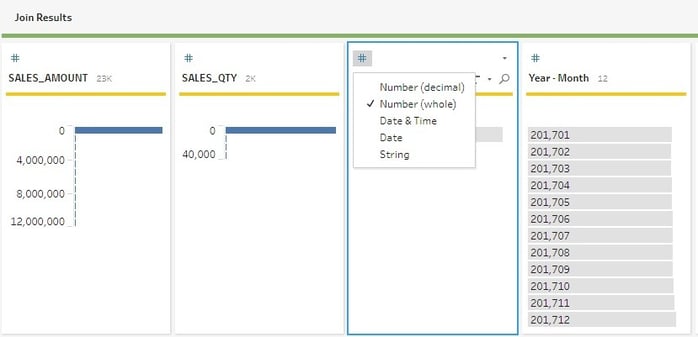
Now, I am going to bring in my spreadsheet with Store Target data and join it to my existing workflow. When I tried to do the joins initially, there was a problem with numeric type key columns matching. This was due to a difference between float (double) columns trying to match with whole number key columns in the spreadsheet. It was easily fixed by changing the datatype in the column edit window.
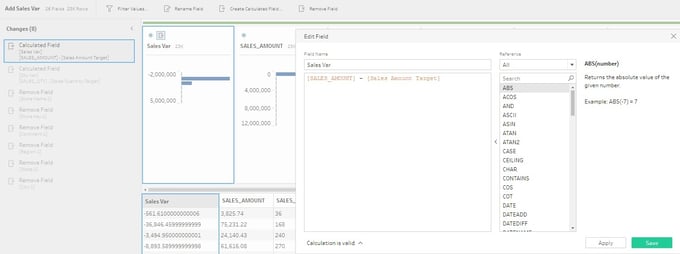
From here, I am going to add a couple of calculated columns that measure the variance between Sales and Sales Targets. This was a straight forward process — clicking Create Calculated Field in the edit column window. The process for creating a calculation in Tableau Prep is the same as creating one in Tableau. The available functions are in a pane on the right-hand side, and you can start typing in the edit box and columns relating to the text you type.
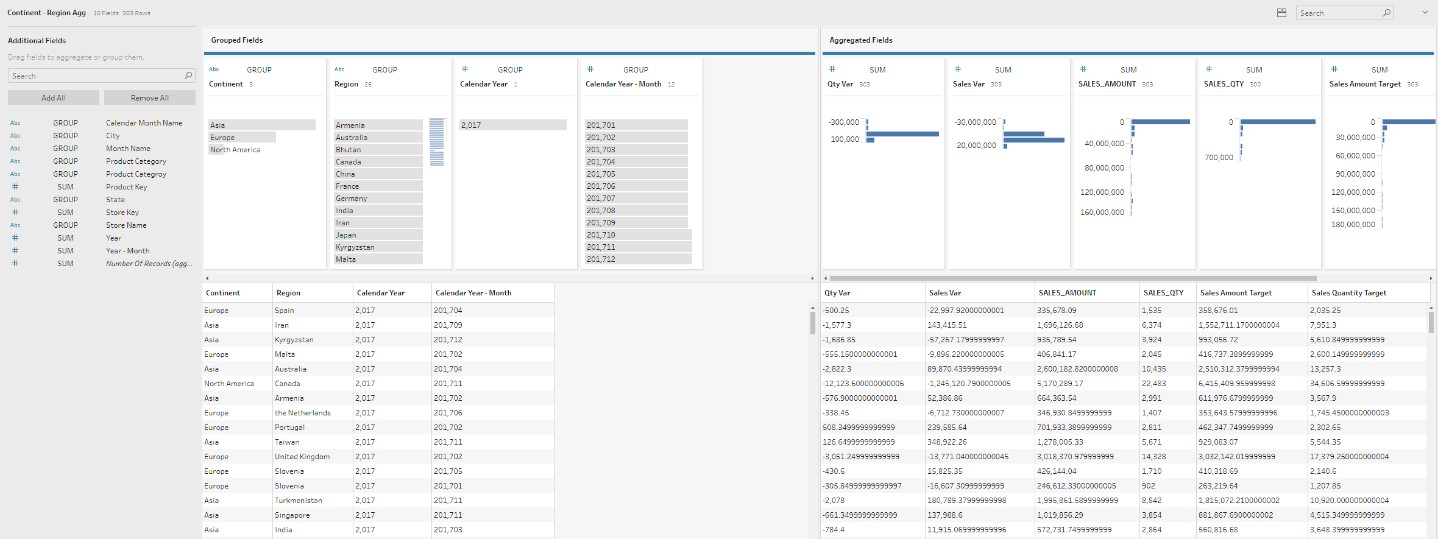
Next, I’m going to create aggregates based on some of my higher-level dimensions. When the add Aggregate step is selected, the user is presented with all of the attributes and measures in the workflow. From the left-hand pane, simply drag and drop the attributes into the Grouped Fields window, and the measures into Aggregated fields window. This automatically creates aggregates for the combination of attributes selected.
Now, it’s time to create my output files. Because I created an aggregate step that doesn’t include all of my attributes, I am going to create two outputs: one for the aggregate and one for the detail.
I can specify the name and save location for each output file and use each of them individually or together in Tableau.
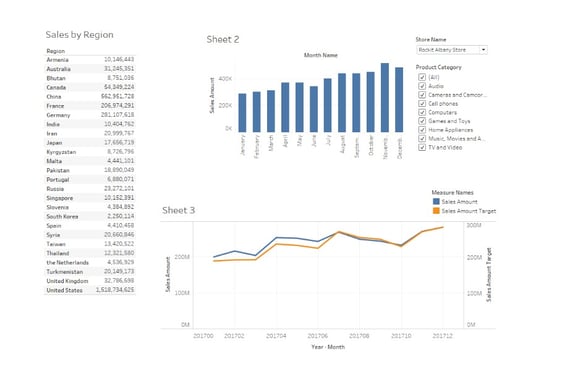
Tableau Prep — The Good
- Simple to understand and use
- Interface is elegant and uncluttered
- Ability to connect to a variety of sources
- Creating aggregates is a simple process
- Ability to run a flow for individual outputs or all
- “How to” videos are easy to access from within the tool
Tableau Prep — The Bad
No save password feature for connections
When opening a workflow from a saved flow that requires a password, there is no way to save the password. That means that each time you open a flow to edit it or run again, you have to supply the password. This behavior is also present in Tableau Desktop.
Although not a showstopper, it makes running flows for files that require updates on a frequent basis more cumbersome.
No way to schedule flows
This is, in my opinion, is the biggest drawback to using Tableau Prep. Each flow you create can only be executed manually. Each time the underlying data changes, you will have to run the flow to update the output file. There is also no way to tell the last time the flow was run outside of looking at the timestamp on the output files themselves. This would potentially make keeping up with stale output files a nightmare in enterprise-level usage situations.
No way to turn off Auto Update while constructing workflows
When working with large datasets, the tool becomes sluggish while the underlying engine processes all of the data with the changes you make to the workflow. While this behavior is understandable, it would be nice to be able to disable auto updates while working with complex workflows or large data sets to minimize wait times.
That concludes part two of this series. In part three, I will be taking an in depth look at Oracle Data Flow.
You might also be interested in…